NYC 2013: The Year in Review

New York City experienced some noteworthy weather in 2013. We bounced between the extremes of our coldest March in seventeen years and a July with extended heat waves.  In fact, we had 17 days this summer with readings at or above 90°F, which is two above normal.  Despite these superlatives, the city’s average temperature for the year was 55.34°F. That is only 0.5°F above our long-term norm.

Precipitation in the Big Apple this year was erratic. We fluctuated between our second wettest June on record and our third driest October. In the end, though, we were mostly dry. The city received a total of 46.32 inches of rain for the entire year.  That is 3.62 inches below normal.  Snowfall, however, was abundant.  February brought the city a blizzard that dumped 11.4 inches of snow in Central Park.  March and December also delivered above average snow totals.  For the year as a whole, the city accumulated 29.6 inches, which is 4.5 inches above average.

On the storm front, the 2013 Atlantic Hurricane season left NYC unscathed. This was a welcome relief after being hit by major storms two years in a row – Irene in 2011 and Sandy in 2012.

Moving into 2014, we are off to an active start. A winter storm warning is currently in effect for the city as a nor’easter makes its way up the coast.

Graph Credit: The Weather Gamut

Graph Credit: The Weather Gamut

Warmest November Ever Recorded for Planet Earth

This past November brought unseasonably cool conditions to most of the United States, including here in New York City.  The rest of the globe, however, experienced exceptional warmth.

According to the National Climatic Data Center, November 2013 was the warmest November ever recorded for the entire planet.  Earth’s combined average temperature for the month – over both land and sea surfaces – was 56.6°F.  That is 1.4°F above the 20th century average.  This November was also the 345th consecutive month that our global temperature was above its long-term norm.

While heat dominated most of the planet, Russia was particularly warm.  Some parts of the vast country, including the Urals, Siberia, and the Arctic Islands in the Kara Sea, posted temperatures of more than 14°F above the monthly average. As a whole, it was that nation’s warmest November since record keeping began in 1891.

Year to date, 2013 is now tied with 2002 as the planet’s 4th warmest year on record.

NCDC_Nov2013Image Credit: NOAA’s National Climatic Data Center

Wildfires in Australia

Wildfires are blazing across southeast Australia. Nearly sixty different fires are currently burning in the state of New South Wales –the country’s most populous region. The largest, nearly 190 miles wide, is burning in the Blue Mountains outside of Sydney.

Since last Thursday, according to local officials, more than two hundred homes have been destroyed and at least one death has been reported. While the exact causes of these intense fires have not yet been identified, recent weather conditions have not been helpful.

According to the Australian Bureau of Meteorology, September 2012 to August 2013 was the country’s warmest twelve-month period on record. On top of that, the past few months have been unusually dry. These extended hot and parched conditions have dried out vegetation, which in turn, is helping to fuel the flames of this massive wildfire outbreak.

While wildfires are common in Australia during the summer, that season does not officially begin until December in the southern hemisphere.  The early start and widespread scope of the current fires are very unusual.

NYC Monthly Summary: July 2013

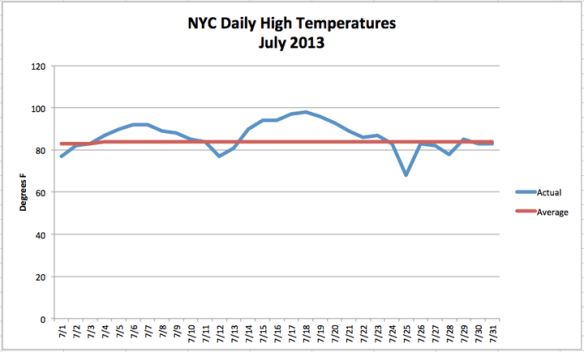
July is usually the hottest month on the calendar for New York City, and this year temperatures soared. We had two separate heat waves and a total of ten days reaching 90°F or higher.  The second heat wave of the month was a lengthy event.  Lasting seven days, it was the city’s longest heat wave in eleven years. This extreme heat brought the city’s average monthly temperature up to 79.8°F. That is 3.8°F above normal.

While searing temperatures dominated the month, the city also experienced a few cooler than average days this July.  In fact, July 25th set a new daily record for the coldest high temperature in Central Park with a peak reading of only 68°F.

In terms of precipitation, NYC was mostly dry.  We received 2.84 inches of rain, which is 1.76 inches below normal.  This was a significant departure from last month’s near record rainfall.

July_TempsGraph Credit: The Weather Gamut

Hottest Decade on Record for Planet Earth: 2001-2010

Climate scientists have noted it for years, but now it is official. The first decade of the 21st century was this planet’s hottest on record.

According to a report recently released by the World Meteorological Organization, Earth’s combined average temperature – over both land and sea surfaces – for the decade of 2001-2010 was 58.05°F.  That is 0.85°F above the long-term norm.  As hot as this period was, this new record does not come as much of a surprise.  Every year in the decade except 2008 was among the top ten warmest on record.

Analyzing data from 139 countries, the report showed that the decade was also marked by extreme weather around the globe. Floods were the most frequent type of event, but droughts impacted the largest number of people worldwide.  Massive hurricanes and scorching heat waves also caused serious problems.  While improved early warning systems for storms and floods helped save countless lives, heat related deaths increased dramatically from the previous decade. In total, extreme weather events during this ten-year period claimed the lives of more than 370,000 people.

Long Duration Heat Wave in NYC

Temperatures have been soaring in New York City. Today was our third consecutive day with temperatures in the 90s and more are on the way.

Forecasters say this heat wave – the second this month in NYC – will be of unusually long duration.  Temperatures are expected to reach the mid-90s everyday for another three to four days. Humidity levels will also remain high, making it feel even hotter.  Heat index values, which combine temperature and humidity, are projected to persist in the triple digits.

While these conditions are oppressive, they are also very dangerous.  Extended exposure can cause a number of serious health hazards.  According to the CDC, extreme heat is one of the leading causes of weather related deaths in this country.

To help people beat the heat, the city is operating cooling centers.  To find one near you, go to nyc.gov.

Weather History: Death Valley Heat Record

One hundred years ago today, the temperature at California’s Furnace Creek in Death Valley National Park soared to 134°F.  To this day, that is the highest air temperature ever recorded on Earth.

Situated in the Mojave Desert and 282 feet below sea level, Death Valley is the lowest and driest place in the United States.  Its unique geography traps hot desert air and helps to heat it even further.  While the area does have seasons, summer is extremely hot.  From June through August, daytime highs in the triple digits and over-night lows in the 90s are not uncommon.

The heat wave that gripped the southwestern U.S. last month had some people thinking the Death Valley record might be broken, especially when the temperature reached 129°F on June 30th.  While this set a new monthly record for June, the century old world record still stands.

Death Valley, CA

Death Valley, CA

Image Credit: NPS

Public Display Thermometers

New York City, like most large cities, is a heat island.  With miles of paved surfaces, it is generally warmer than surrounding rural areas.

Within city limits, public display thermometers – on banks and gas stations – demonstrate this phenomenon on a micro scale. They are often positioned in the sun and over a concrete or asphalt surface that absorbs heat. As a result, they can read 5°F to 10°F higher than the city’s official air temperature taken in the more bucolic conditions of Central Park.

Gas station thermometer reads 104F, but the official high temeprature for the day was 92F.

The thermometer on this NYC gas station reads 104°F, but the official high temeprature for the day was 92°F.

Image Credit: The Weather Gamut

Heat Index

Temperature is one of the basic elements of weather.  Our perception of it, however, is often influenced by other factors.  In summer, this is usually humidity.

The heat index, developed in the late 1970’s, is a measure of the apparent or “real feel” temperature when heat and humidity are combined.  Since the human body relies on the evaporation of its perspiration to cool itself, the moisture content of the air affects comfort levels. Basically, as humidity levels increase, the rate of evaporation decreases and the body can begin to feel overheated.  For example, an air temperature of 92°F combined with a relative humidity level of 60% will produce a heat index value of 105°F.

The National Weather Service issues heat advisories when the heat index is forecast to be at least 95°F for two consecutive days or 100°F for any length of time.  Extended exposure to high heat index values can lead to serious health hazards.

Heat-IndexImage Credit: NOAA

Record Heat in Alaska

Extreme heat is baking Alaska. In fact, some parts of this subarctic state were as warm or warmer than Miami, FL this week.

According the National Weather Service, the temperature in Talkeetna, AK reached a sweltering 96°F on Monday, smashing the previous record of 91°F set in 1969. Cordova and Valdez, each reported readings of 90°F.  In Anchorage, the mercury only made it to 81°F on Tuesday, but it was still enough to break a daily record that was in place since 1926. The average high for this time of year in south-central Alaska is in the mid-60s.

This unusual heat was the result of a strong ridge of high-pressure locked in place over the region for the past few days.  These soaring temperatures, however, are not likely to last much longer.  Forecasters expect conditions to cool down by the end of the week.