How Thunder and Lightning Form

Flash! Bang! Thunderstorms are impressive displays of the power of nature. But how, you may wonder, do lightning and thunder form?

First comes the lightning, an intense electrical discharge. While not completely understood, it is believed to form as a result of the separation of charges within a cumulonimbus cloud.  One theory of how this happens involves the collision of particles within these towering clouds, including hailstones, super-cooled liquid water droplets, and ice crystals.  When they mix and collide, according to NOAA, “electrons are sheared off the ascending particles and collect on the descending particles.” This results in a cloud with a negatively charged base and a positively charged top.

As the atmosphere is a good insulator, generally inhibiting the flow of electricity, the strength of this electrical field has to build up substantially before lightning can occur. Most discharges, about 75%, occur across the electrical field within the storm cloud itself. This is known as intra-cloud lightning.

Another electrical field can also develop below the cloud. Since the cloud base is negatively charged, it induces a positive charge on the ground below, especially in tall objects such as buildings and trees. When the charge separation becomes large enough, a negatively charged stepped leader – an invisible channel of ionized air, moves down from the base of the cloud. When it meets a channel of positive charges reaching up from the ground, known as a streamer, a visible flash of lightning can be seen.  This is called cloud to ground lightning.

Lightning can be as hot as 54,000°F, a temperature that is five times hotter than the surface of the sun. When it occurs, it heats the air around it in a fraction of a second, creating an acoustic shock wave.  This is thunder.  A nearby lightning strike will produce thunder that sounds like a sharp crack. Thunder from a distant storm will sound more like a continuous rumble.

While thunderstorms can be spectacular events to watch, they are also very dangerous.  So, as the National Weather Service recommends, “When thunder roars, go indoors.”

Credit: NWS

Credit: NWS

Summer Solstice 2014

Today is the June Solstice, the first day of summer in the northern hemisphere. The new season officially began at 10:51 UTC, which is 6:51 A.M. Eastern Daylight Time.

The astronomical seasons are produced by the tilt of the Earth’s axis – a 23.5° angle – and the movement of the planet around the sun. During the summer months, the northern half of the Earth is angled toward the sun. This position allows the northern hemisphere to receive the sun’s energy at a more direct angle and produces our warmest temperatures of the year.

Since the winter solstice in December, the arc of the sun’s daily passage across the sky has been moving northward and daylight hours have been increasing. Today, it reached its northern most position at the Tropic of Cancer and marks the “longest day” of the year. This observable stop is where today’s event takes its name.  Solstice is a word derived from Latin meaning, “sun stands still”.

Now, the sun will start to move southward again in our sky and daylight hours will slowly start to decrease.

Seasons

The position of the Earth during different seasons. Image Credit: NASA

The Sun is directly overhead on Summer Solstice at the latitude known as the Tropic of Cancer.  Image Credit: NASA

The Sun is directly overhead at the Tropic of Cancer on the Summer Solstice. Image Credit: NASA

Green Skies

Thunderstorms are fairly common in the late spring and summer in the United States. Every once in a while, though, they can be severe. When they are, the sky often turns green. You may wonder, what causes this odd coloration?

According to scientists, the phenomenon of green skies is not completely understood. The leading theory, however, involves the dense moisture content of cumulonimbus clouds and the time of day. Most thunderstorms develop in the late afternoon, a time when the sun’s rays have to travel a long way through the atmosphere before reaching the ground. This causes the light we see around sunset to be reddish-yellow. Thunderstorm clouds contain large amounts of rain and hail. This water and ice scatters blue light. So, when these towering clouds form in the late afternoon, the two colors mix to give the sky a green or blue-green appearance.

While severe thunderstorms can produce tornadoes, a green sky does not necessarily mean a twister is coming. Nonetheless, the color is associated with dangerous weather. If you see a thunderstorm heading your direction and the sky appears green, you should seek shelter immediately.

Green Sky.  Image Credit: Sky7WX

Green Sky.   Image Credit: Sky7WX

NYC Monthly Summary: August 2013

In spite of getting off to a cool start, August hovered around average in New York City this year.  Nineteen out of thirty-one days posted below average temperatures, but one day reached the 90°F mark.  All together, the city’s average monthly temperature was 74.6°F. That is only 0.4°F below normal.

In terms of precipitation, NYC was mostly dry.  Despite a few heavy downpours, the city only collected 2.85 inches of rain in Central Park.  That is 1.59 inches below normal. This was the second month in a row that we received below average rainfall.

August TempsGraph Credit: The Weather Gamut

NYC Monthly Summary: July 2013

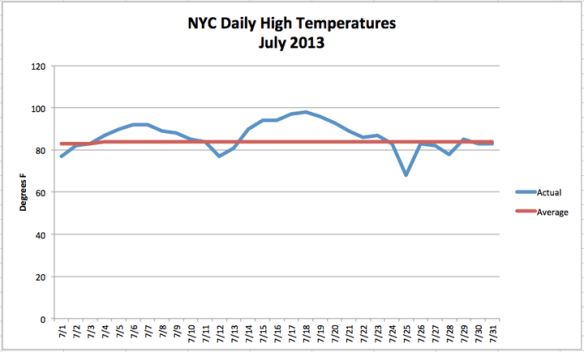
July is usually the hottest month on the calendar for New York City, and this year temperatures soared. We had two separate heat waves and a total of ten days reaching 90°F or higher.  The second heat wave of the month was a lengthy event.  Lasting seven days, it was the city’s longest heat wave in eleven years. This extreme heat brought the city’s average monthly temperature up to 79.8°F. That is 3.8°F above normal.

While searing temperatures dominated the month, the city also experienced a few cooler than average days this July.  In fact, July 25th set a new daily record for the coldest high temperature in Central Park with a peak reading of only 68°F.

In terms of precipitation, NYC was mostly dry.  We received 2.84 inches of rain, which is 1.76 inches below normal.  This was a significant departure from last month’s near record rainfall.

July_TempsGraph Credit: The Weather Gamut

Weather and Health: Sun Exposure

Summer is a season when many people spend time outdoors in the sun.  Overexposure to its UV rays, however, can cause a number of health problems, including sunburn, eye damage, and even skin cancer  This is why public health officials recommend taking precautions when the UV Index climbs above three.

The UV index is a scale that measures the intensity of the sun’s ultraviolet radiation. Readings vary from place to place as local factors affect the amount of UV light that reaches the ground. These include, the thickness of the ozone layer, latitude, season, elevation, and cloud cover. Developed by the NWS and EPA in the early 1990’s, it informs the public about the daily risk of unprotected exposure to the sun.

UV_Index

Chart Data: EPA

Long Duration Heat Wave in NYC

Temperatures have been soaring in New York City. Today was our third consecutive day with temperatures in the 90s and more are on the way.

Forecasters say this heat wave – the second this month in NYC – will be of unusually long duration.  Temperatures are expected to reach the mid-90s everyday for another three to four days. Humidity levels will also remain high, making it feel even hotter.  Heat index values, which combine temperature and humidity, are projected to persist in the triple digits.

While these conditions are oppressive, they are also very dangerous.  Extended exposure can cause a number of serious health hazards.  According to the CDC, extreme heat is one of the leading causes of weather related deaths in this country.

To help people beat the heat, the city is operating cooling centers.  To find one near you, go to nyc.gov.

Rip Currents

The dog days of summer have arrived!  As millions of people head to beaches to beat the heat, it is important to remember that the ocean is a dynamic environment that can pose a number of hazards for swimmers.  Chief among these are rip currents.

Rip currents are strong, localized channels of water that move away from the shoreline. They can form on any beach with breaking waves and easily pull swimmers out to sea in a matter of seconds.  According to the U.S. Lifesaving Association, rip currents are responsible for 80% of all surf zone rescues. Nationally, they cause more than one hundred deaths every year.

While rip currents are a serious hazard for all beach goers, they are a natural part of the near-shore ocean circulation.  They develop when wind driven waves break strongly in one area and weakly in another, creating a circulation cell as the water looks for a way back out to sea.  This usually happens at a break in an underwater sandbar or along a jetty or pier. Extending seaward for hundreds of yards, rip currents typically travel at one to two feet per second.  However, they strengthen when onshore wind speeds pick up and wave height and frequency increase.

If caught in a rip current, do not try to swim against it.  Instead, swim parallel to the shoreline until you are out of the current and then make your way back to the beach.

rip-currentImage Credit: NOAA

Public Display Thermometers

New York City, like most large cities, is a heat island.  With miles of paved surfaces, it is generally warmer than surrounding rural areas.

Within city limits, public display thermometers – on banks and gas stations – demonstrate this phenomenon on a micro scale. They are often positioned in the sun and over a concrete or asphalt surface that absorbs heat. As a result, they can read 5°F to 10°F higher than the city’s official air temperature taken in the more bucolic conditions of Central Park.

Gas station thermometer reads 104F, but the official high temeprature for the day was 92F.

The thermometer on this NYC gas station reads 104°F, but the official high temeprature for the day was 92°F.

Image Credit: The Weather Gamut

NYC Monthly Summary: June 2013

One word can sum up the weather in New York City this June, wet. Receiving 10.10 inches of rain in Central Park, which is 5.69 inches above average, this was the second wettest June ever recorded in the Big Apple.  Nearly half of this impressive total came down in one day when the remnants of Tropical Storm Andrea passed through the area, breaking a daily rainfall record. Given this abundant precipitation, it is interesting to note that NYC’s top three wettest Junes have all occurred in the past eleven years.

In terms of temperature, the city finished the month with an average reading of 72.7°F.  That is 1.7°F above normal.  While New York did not technically have a heat wave this June, the last week of the month was extremely hot and humid.  In fact, heat index values were high enough for the NWS to issue a heat advisory for the city.

JuneRain_NYC

Table: The Weather Gamut